Policy
From Peak To Trough To Rebound In 60 Days: The Covid Recesison
The recession that was -- from February 2020 to April 2020 -- goes down as a record-breaker for its speedy duration. Except for the millions still living in its grip, and in fear of its next wave of pain.
Sixty days.
COVID-19 redefined as it upended.
Out of the gate, in February 2020, the pandemic triggered upheaval in measures of income, employment, retail sales, and industrial production. The "decline in activity" across all of these fields of data checked the boxes.
And as the calendar year tipped from Q1 into Q2, the freefall was too profound for the National Bureau of Economic Research – the entity that determines whether the economy is in recession or not – to call it anything but that, a recession.
But tracking all of the benchmarks from that freefall from the economic peak in February – income, employment, retail sales, and industrial production – to the point from which things could get any worse, and started to improve, the NBER has landed on April 2020 as its trough month. May 2020, then, began the new expansion.
Here's how the NBER explains its determination:
On the employment side, the committee normally views the payroll employment measure produced by the Bureau of Labor Statistics (BLS), which is based on a large survey of employers, as the most reliable comprehensive estimate of employment. This series reached a clear trough in April before rebounding strongly the next few months and then settling into a more gradual rise. However, the committee recognized that this survey was affected by special circumstances associated with the COVID-19 pandemic in early 2020. In the survey, individuals who are paid but not at work are counted as employed, even though they are not in fact working or producing. Workers on paid furlough, who became more numerous during the pandemic, thus resulted in an overcount of people working. Accordingly, the committee also considered the employment measure from the BLS household survey, which excludes individuals who are paid but on furlough. This series also shows a clear trough in April. The committee concluded that both employment series were thus consistent with a business cycle trough in April.
The committee believes that the two most reliable comprehensive estimates of aggregate production are the quarterly estimates of real Gross Domestic Product (GDP) and of real Gross Domestic Income (GDI), both produced by the Bureau of Economic Analysis (BEA). Both series attempt to measure the same underlying concept, but GDP does so using data on expenditure while GDI does so using data on income. These measures estimate production that occurred over an entire quarter and are not available monthly. The most comprehensive income-based monthly measure of aggregate production is real personal income less transfers, from the BEA. The deduction of transfers is necessary because transfers are included in personal income but do not arise from production. This measure reached a clear trough in April 2020. The most comprehensive expenditure-based monthly measure of aggregate production is monthly real personal consumption expenditures (PCE), published by the BEA. This series also reached a clear trough in April 2020.
Using the same rational – that Q1 2020 contained the prior economy recovery's peak and that Q3 2020 clearly reflected strides forward in all the key economic performance indicators – Q2 gets tagged as the quarterly trough in the COVID Recession of 2020. Importantly, per NBER, two consecutive quarters of decline in real GDP are not necessary, by definition, to qualify a recession, nor to define its duration.
Now, housing, as people who eat, sleep, and breathe it know, did more than its fair share – second, maybe to Uncle Sam – to turn the economy around last year on a dime. Here's a passage from the Congressional Research Service that shows how powerfully residential construction and development – declared essential ongoing services and supported with extraordinary economic and financial stimulus – impacted the stabilization and rebound.
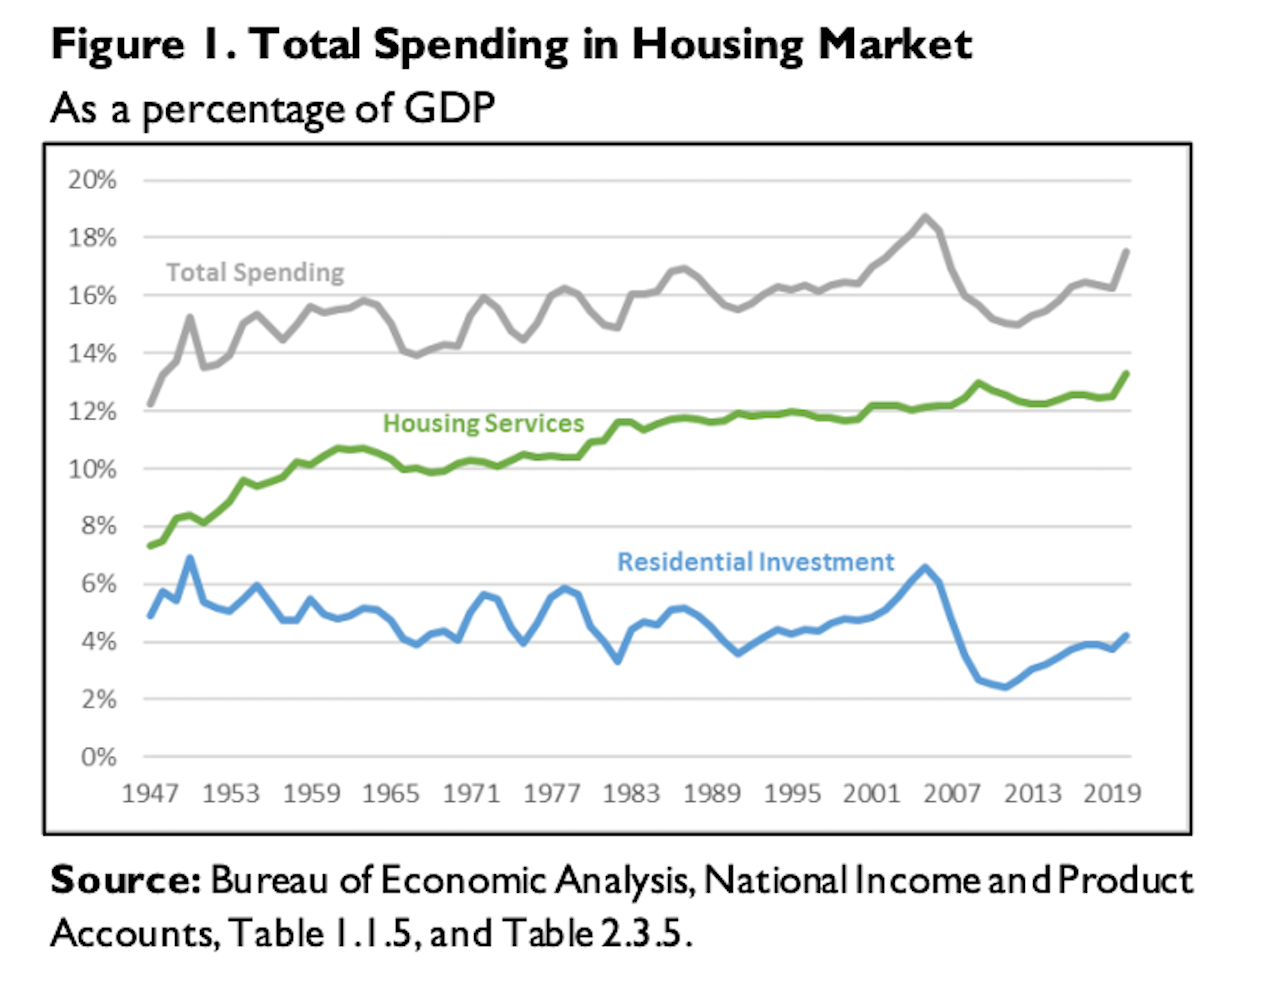
As of 2020, spending on residential fixed investment was about $885 billion, accounting for about 4.2% of GDP. Second, GDP includes all spending on housing services, which includes renters’ rents and utilities and homeowners’ imputed rent and utility payments. As of 2020, spending on housing services was about $2.8 trillion, accounting for 13.3% of GDP. Taken together, spending within the housing market accounted for 17.5% of GDP in 2020.
No doubt, a major contributor at a time the nation so needed an industry to rise up. And housing did so. Still, a serious challenge runs beneath and through these economic broad strokes and positive notes, and that is that the data are pinned to means and averages that can distort a realer, fuller accounting for both the economic damage of the pandemic and its more lasting, more ruinous impacts.
Calling the COVID Recession a record-breaker in brevity may be precise through the lens of the measurables that reflect healthy economic conditions on average. However, a K Recession and a K Recovery – one that leaves millions on the sidelines of long-term unemployment, and millions more forced altogether out of the labor participation count due to either pandemic-related premature, involuntary retirement or family obligations.
Bloomberg correspondent Catarina Saraiva writes that for both jobs and real estate, levels of inequality widened during the course of the pandemic recession and recovery:
The diverging strokes of the letter K represent the differing fortunes of the haves and have-nots following the deepest recession in decades. As joblessness surged and many households struggled to pay the bills, plenty of Americans were able to work from home and benefit from a sharp rise in asset values. Unprecedented stimulus from the Federal Reserve kept mortgage rates low and encouraged investors to buy equities. America’s richest people have seen their fortunes balloon.
Even as talk of yet another recession – this one following on the heels of Central Bank attempts to manage inflation by raising the costs to borrow and leverage debt on debt for growth – rises in volume, some fair number of Americans are celebrating history's shortest recession on record.
For others, the trough is a condition that shows no glimmer of improvement.